Historical Trends
See key trends across years
College Kickstart has built the industry-leading data engine for high school counselors. We help schools turn admissions data into insight, however deep or often you need it.
CK360, our flagship analytics platform, gives counseling teams a live, interactive dashboard for exploring outcomes, trends, and historical class profiles year-round. For teams that just need the numbers, our Full Access Reports deliver those same insights on demand, whenever your data updates. And when you need a one-time, board-ready report on a tight deadline, our Board Reporting Service turns your data into a polished report package in 2-3 business days.
Whatever your team's size, budget, or reporting cadence, there's a College Kickstart data solution built for it.
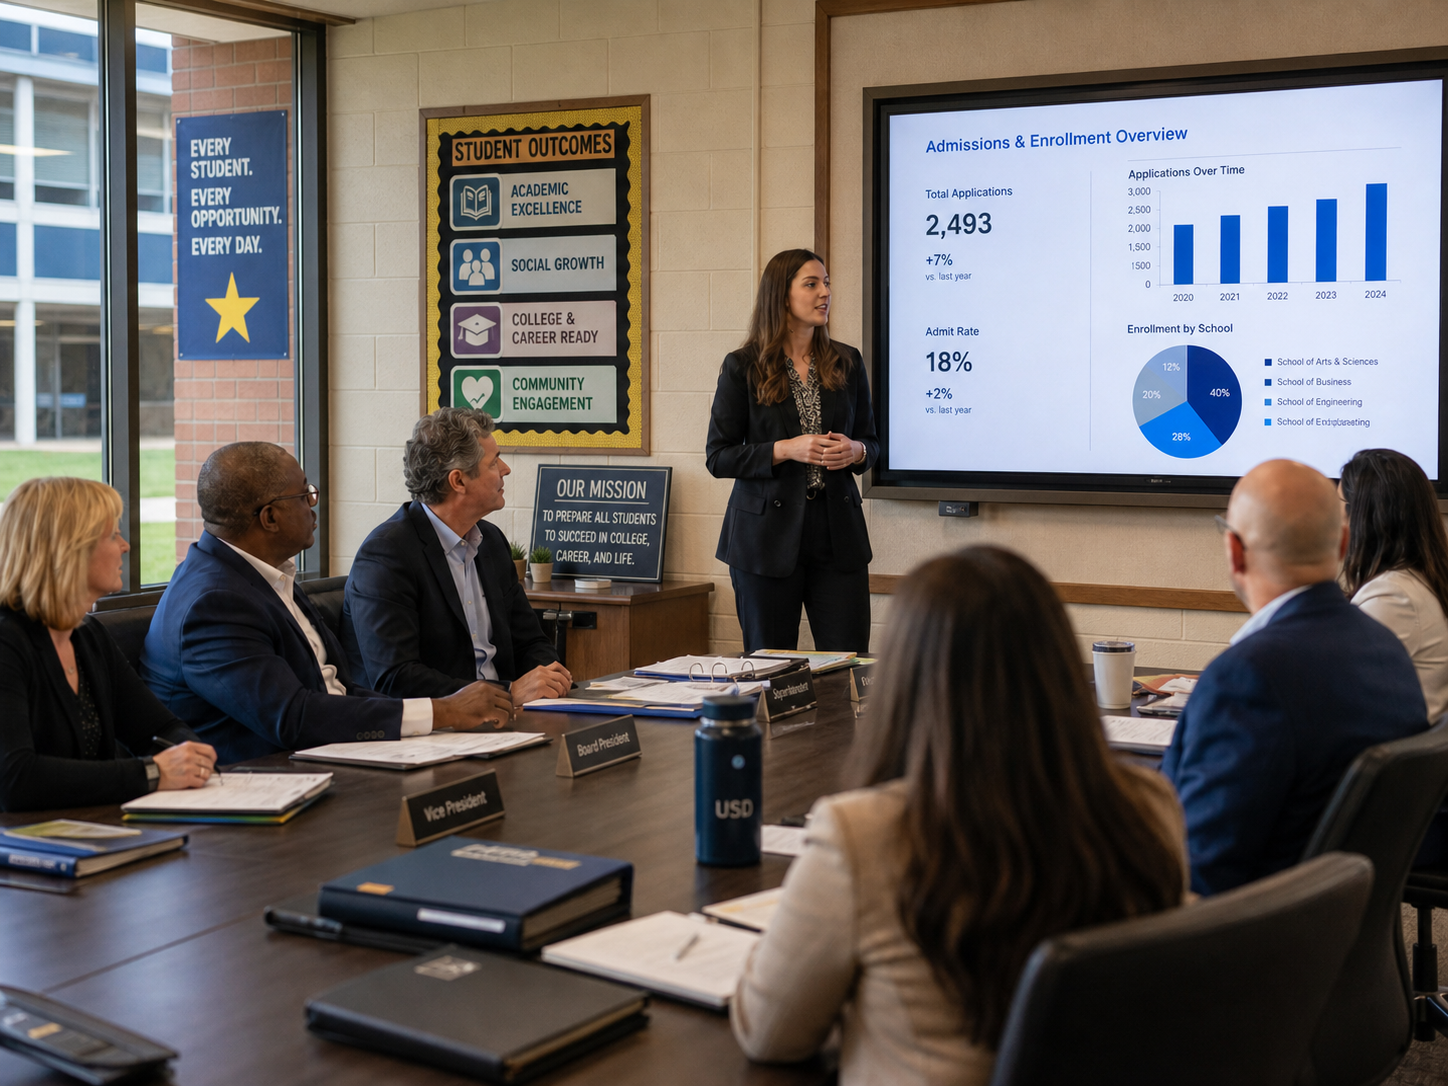
CK360 gives schools dashboard views that combine local outcomes with the latest national admissions data, helping counseling teams prepare for student, parent, leadership, and board conversations throughout the cycle. Visuals are easily customized to help you find the answers you are looking for.
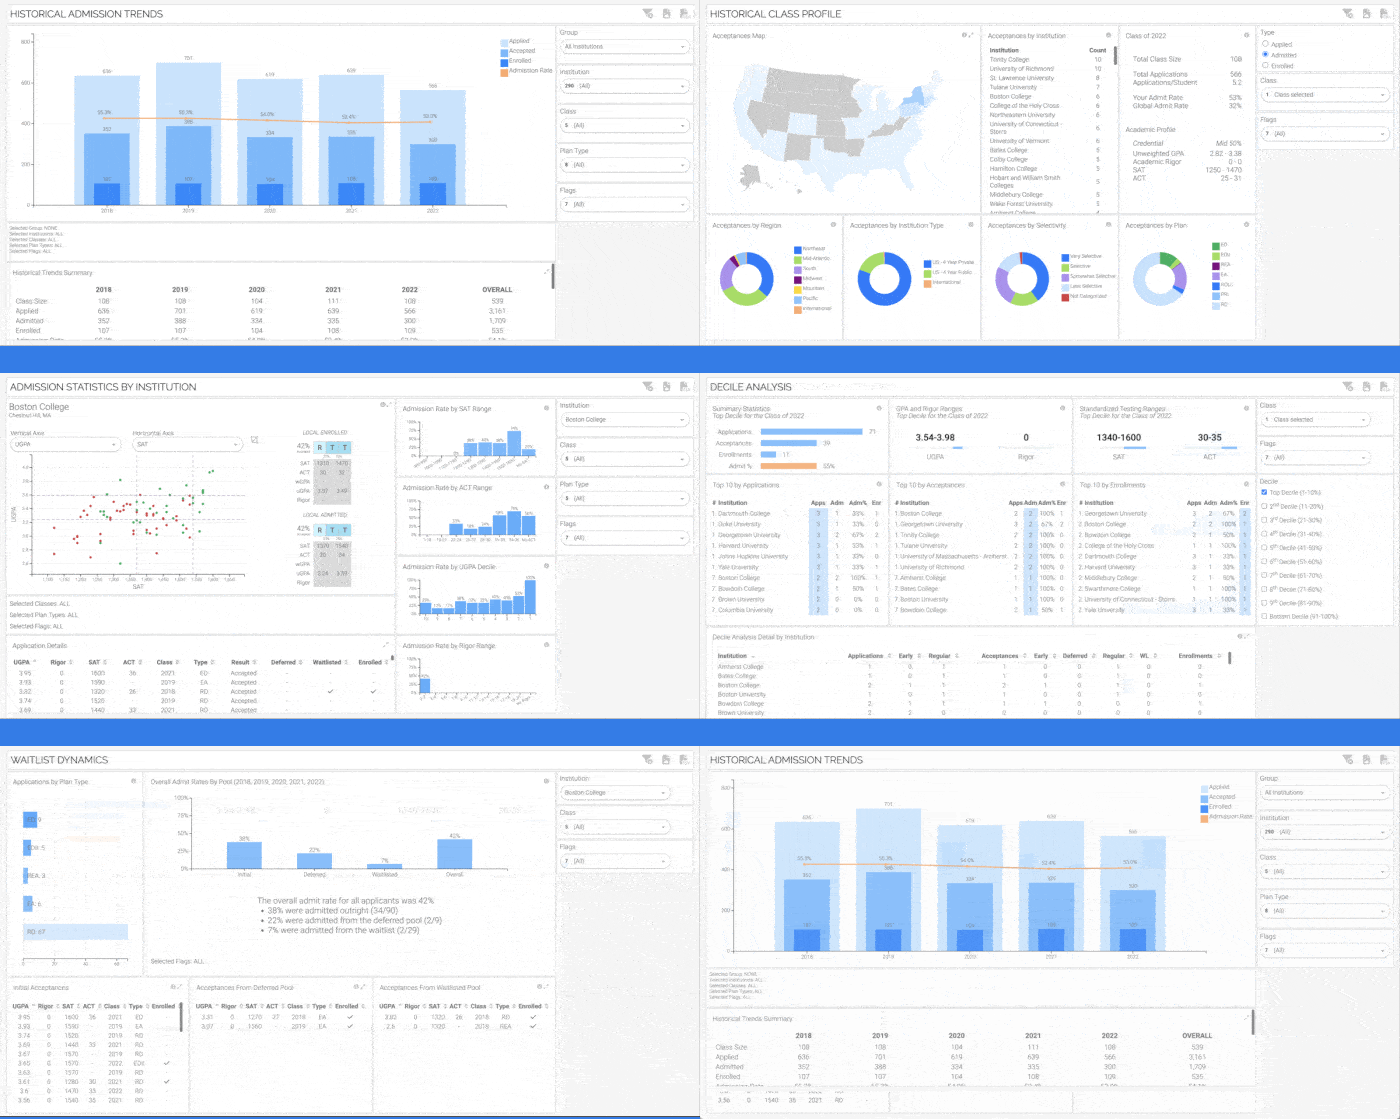
See key trends across years
Understand the details of where a class got in and where they are going
See your school's history at specific institutions
Break down the class by academic performance
Identify how your admit results compare to expectations
Visualize your students' improvement and engagement
Zoom in on how academic performance impacts acceptance
Understand the impact of going test optional
Look at performance off the waitlist
Understand how GPA quintiles perform by selectivity
No manual data wrangling. No chasing down statistics. No last-minute scrambling before a board meeting.
Export your most recent three years of admissions results from Naviance, Maia Learning, Cialfo, or SCOIR as a standard CSV file.
Our team enriches your data with current national admission rates and the latest available rankings.
Your Outcome Summary report, plus any additional add-on reports you selected, is returned within 2-3 business days.
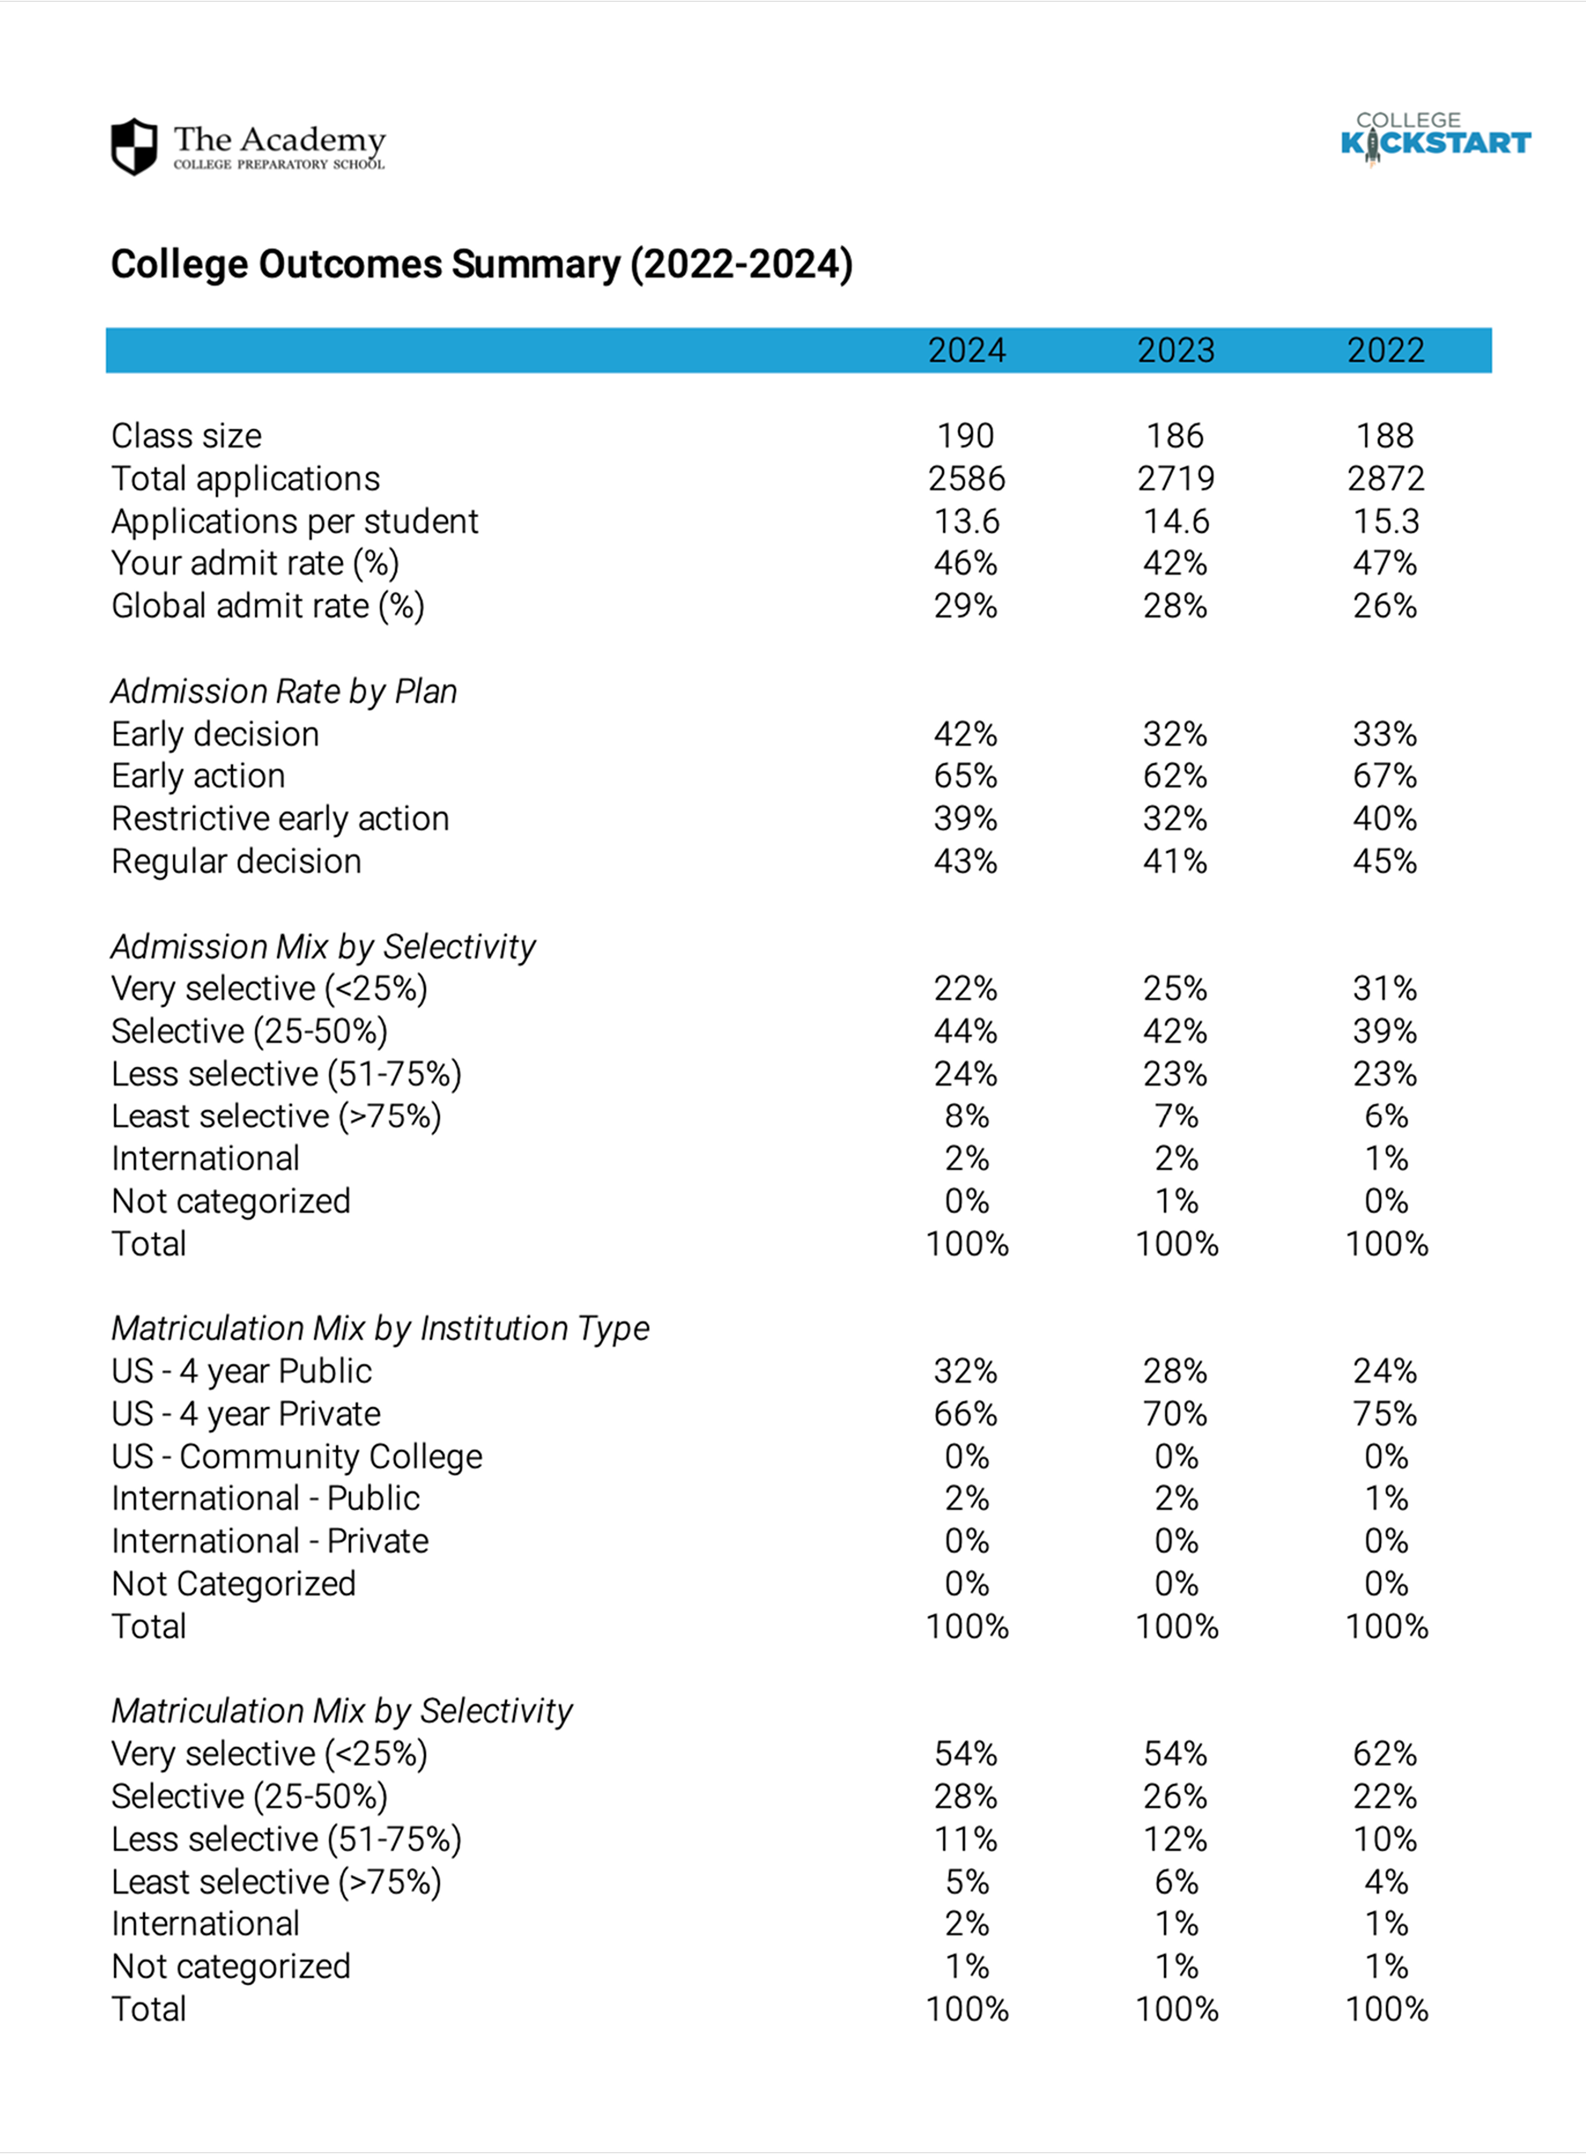
The Standard tier includes a single Outcome Summary report. Within that report, admissions outcomes are organized into clear sections covering trends, application plans, popular institutions, waitlists, rankings, and academic quintiles so your board can see the full story in one place.
A three-year summary of admission and matriculation highlights including class size, applications per student, and your school's overall admission rate compared to national and global benchmarks across 790+ institutions.
Results broken out by institution type, geographic region, and admissions selectivity, giving your board a clear picture of where students are being accepted and choosing to enroll over time.
A detailed breakdown of Early Decision and Early Action trends tracking applications, admittances, and enrollments by application plan type so your board understands how early admission is shaping your outcomes.
Tabulated three-year results for the 30 most popular institutions by application volume at your school, including the latest available admission rates to keep trend analysis current.
Waitlist activity tracked three ways: in aggregate, by admissions selectivity, and at an institutional level for the colleges most popular with your students.
Your most recent graduating class segmented by Barron's and U.S. News rankings with breakdowns of applicants, admittances, and enrollments by cohort, including Ivy and Ivy+ analysis. An objective admissions selectivity measure is also included for schools that prefer a rankings-neutral assessment.
Enrollment mix and admission rate breakdowns by academic quintile giving your board visibility into outcomes across all performance cohorts, not just the top of the class.
Plus builds on the Outcome Summary report with three additional reports for counseling teams that need more detailed institutional, worksheet, and cohort-level analysis.
A comprehensive breakdown of applications, admittances, and enrollments by academic cohort, including top schools by applications, admits, and matriculations for each quintile. A powerful way to demonstrate that every student, at every performance level, is being effectively supported.
A flexible spreadsheet for preparing admission and matriculation summaries for your school profile, with multiple format options depending on whether you want to show institutional counts or not.
A detailed admissions history for every institution with at least five admitted or enrolled students from your school, including a comparison of your historical admission rates and academic profiles against national data, breakdowns by application type, and hooked vs. unhooked applicant analysis for schools that track hooks in Naviance.
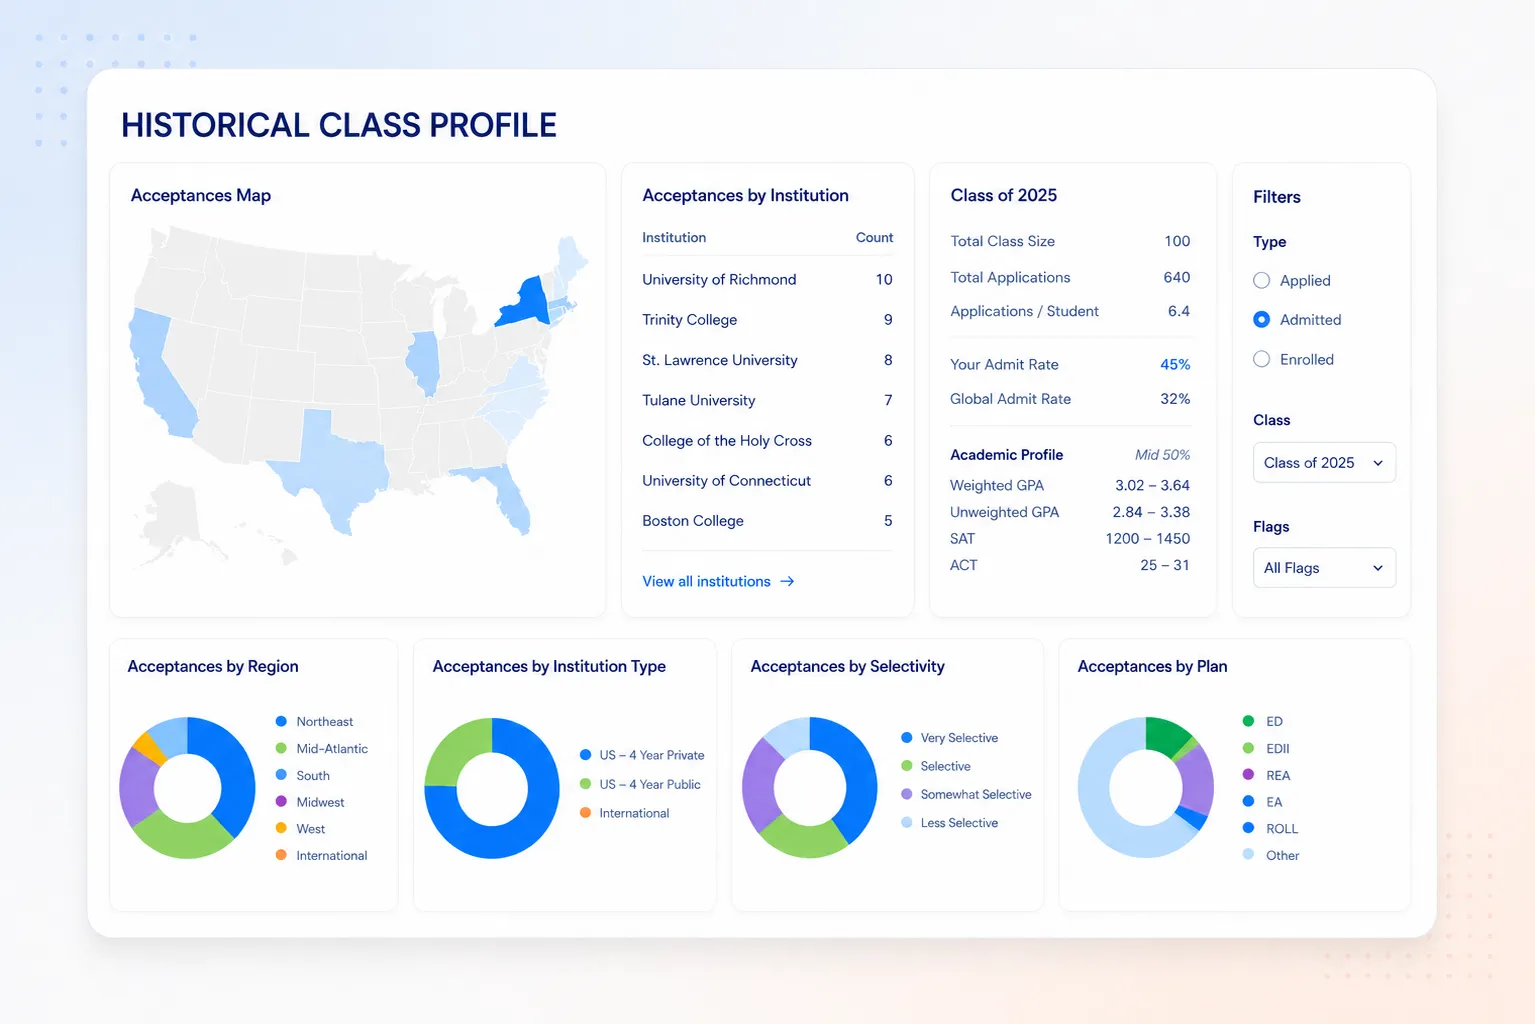
Full Access Reports adds on 4 reports on hooked applicants and Test-Optional outcomes. Run reports multiple times through the year as new data comes in. Assigned a dedicated relationship manager to help with any questions or needs.
The service works with standard CSV exports from Naviance, Maia Learning, Cialfo, and SCOIR. If you use a different system of record, contact us to discuss compatibility.
Reports are delivered within 2-3 business days of data upload.
A standard CSV export of admissions results for the most recent three years from your platform of record.
Quintile reporting segments your graduating class into five academic performance groups and analyzes admission and enrollment outcomes for each group separately. It gives boards a more nuanced view of how students across the full academic spectrum are being supported and where results are strongest or weakest.
Manual board reporting typically requires counselors to compile data from multiple sources, cross-reference national statistics, and format everything for presentation — a process that can take days. The College Kickstart Board Reporting Service automates the data enrichment and analysis, delivering a complete, board-ready report in 2-3 business days.
Yes. Every report is enriched with the latest available Barron's and U.S. News rankings data, along with an objective admissions selectivity measure for schools that prefer a rankings-neutral alternative.
Walk through the platform with one of our relationship managers — usually 30 minutes, always tailored to your school.