22 May 2024
Class of 2028 Waitlist Notification Dates and Stats
UPDATE #3 (6/27)
 For those of you who have been waitlisted at one of your top choices, here's our initial update of Class of 2028 waitlist notification dates and status where available.
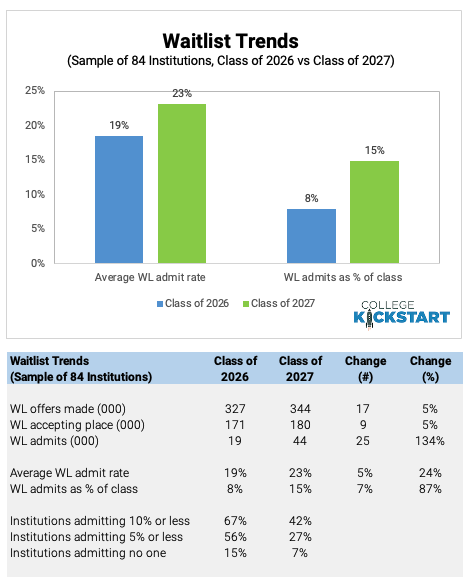
To get a sense for what's happening at the macro level, we took a look at recently released Class of 2027 waitlist statistics from 84 private and public institutions. Our analysis paints the following picture:
- The number of students admitted from the waitlist increased 134 percent year over year from 19,000 for the Class of 2026 to 44,000 for the Class of 2027
- On average, 23 percent of Class of 2027 students accepting a place on a waitlist were admitted, down from 19 percent in for the Class of 2026
- Students admitted from the waitlist accounted for 15 percent of Class of 2027 enrollments, up from 8 percent for the Class of 2026
- 42 percent of the schools sampled admitted 10 percent or less of the students accepting a place on the waitlist for the Class of 2027 (vs. 67 percent for the Class of 2026)
Be sure to bookmark this page as we expect to be updating status over the next several weeks.
Click Continue Reading for the list.
Class of 2028 Waitlist Notification Dates and 2023 Statistics
College Kickstart LLC
| Institution | Waitlist Offered (2023) | Waitlist Accepted (2023) | Waitlist Admitted (2023) | Admit Rate (2023) | Notification Date | Link |
|---|---|---|---|---|---|---|
| American | by 5/31 | Link | ||||
| Amherst | 924 | 599 | 47 | 8% | ||
| Bates | 2,198 | 855 | 68 | 8% | most by 6/30, no later than 8/1 | Link |
| Boston College | Expect active waitlist of 4,000 students | ADMISSIONS | ||||
| Boston University | 15,033 | 8,907 | 34 | 0% | ||
| Bowdoin | begins after 5/1 | Link | ||||
| Bucknell | 2,714 | 1,233 | 1 | 0% | ||
| Cal Poly Pomona | 1,807 | 925 | 791 | 86% | after 6/1 | Link |
| Cal Poly SLO | 13,178 | 0 | 193 | by 7/15 | Link | |
| Caltech | by mid-July | Link | ||||
| Carleton | 782 | 356 | 35 | 10% | ||
| Case Western | 11,841 | 7,940 | 1,141 | 14% | ||
| Chapman | 2,847 | 1,473 | 208 | 14% | after 5/1 | Link |
| Claremont McKenna | 591 | 396 | 44 | 11% | ||
| Holy Cross | 3,700 | 1,572 | 42 | 3% | ||
| William & Mary | 3,833 | 1,918 | 136 | 7% | by 8/1; update mid-June | Link |
| Colorado College | 684 | 144 | 20 | 14% | ||
| Colorado School of Mines | by 5/15 | Link | ||||
| Connecticut College | 2,929 | 1,320 | 19 | 1% | after 5/1 | Link |
| Cornell | 8,282 | 6,166 | 362 | 6% | by 7/1 | Link |
| Dartmouth | 2,352 | 1,606 | 0 | 0% | by 6/30 | Link |
| Davidson | 1,616 | 710 | 14 | 2% | 5/1 - 6/24 | Link |
| Dickinson | 901 | 236 | 71 | 30% | begins mid-April; ~600 typically offered waitlist spot | Link |
| Emory | 6,081 offered waitlist to Emory College; 3,287 to Oxford College | ADMISSIONS | ||||
| Georgetown | by 5/15 | ADMISSIONS | ||||
| Georgia Tech | 5,809 | 4,016 | 60 | 1% | after 5/15 | Link |
| Grinnell | by early July | Link | ||||
| Hamilton | 2,258 | 1,249 | 41 | 3% | begins 5/1 | Link |
| Harvey Mudd | 604 | 406 | 57 | 14% | ||
| Haverford | 1,342 | 740 | 27 | 4% | ||
| Howard | by 5/15 | Link | ||||
| Indiana | 2,657 | 1,317 | 1,143 | 87% | by 7/1 | Link |
| James Madison | 4,589 | 1,850 | 141 | 8% | majority in June, as late as 8/1 | Link |
| Johns Hopkins (RD) | 2,478 | 1,748 | 71 | 4% | after 5/1 | Link |
| Kenyon | by 6/30 | Link | ||||
| Lehigh | 4,456 | 2,098 | 144 | 7% | Link | |
| Macalester | 653 | 354 | 60 | 17% | by 5/31 | Link |
| Middlebury | 2,778 | 2,734 | 36 | 1% | ||
| MIT | update 5/15 at earliest | Link | ||||
| NYU | by 8/1 | Link | ||||
| NC State | 8,636 | 3,260 | 267 | 8% | by 6/15 | Link |
| Occidental | 1,534 | 841 | 60 | 7% | ||
| Ohio State | by 6/1 | Link | ||||
| Penn State | 4,903 | 3,114 | 84 | 3% | Link | |
| Pitzer | 621 | 202 | 10 | 5% | ||
| Pomona | 845 | 587 | 62 | 11% | update early-mid May | Link |
| Providence | 3,642 | 1,124 | 199 | 18% | update mid-May | Link |
| Purdue | 14,184 | 5,252 | 466 | 9% | after 5/1 | Link |
| Reed | 5,508 | 2,370 | 100 | 4% | beginning in April | Link |
| RPI | 2,574 | 1,735 | 74 | 4% | April-June | Link |
| Saint Michaels | typically by mid-June | Link | ||||
| Santa Clara | 4,978 | 2,944 | 367 | 12% | ||
| Scripps | 704 | 337 | 74 | 22% | begins late May | Link |
| Sewanee | 243 | 66 | 5 | 8% | ||
| Skidmore | 29,033 | 1,343 | 15 | 1% | ||
| SMU | 1,703 | 821 | 292 | 36% | after 5/1 | Link |
| Stanford | 607 | 506 | 76 | 15% | by 7/1 | Link |
| SUNY Stony Brook | 3,647 | 1,793 | 1,577 | 88% | ||
| Syracuse | 14,714 | 5,933 | 1,647 | 28% | after 6/1 | Link |
| TCU | 3,183 | 974 | 273 | 28% | typically final two weeks of April | Link |
| Trinity College | late April to 7/31 | Link | ||||
| Tulane | 4,062 | 2,168 | 43 | 2% | by 7/1 | Link |
| Union College | 441 | 206 | 22 | 11% | beginning late April | Link |
| UC Berkeley | 7,001 | 4,820 | 1,191 | 25% | between May and July | Link |
| UC Davis | 19,446 | 10,898 | 4,387 | 40% | between May and July | Link |
| UC Irvine | between May and July | Link | ||||
| UCLA | between May and July | Link | ||||
| UC Merced | between May and July | Link | ||||
| UC Riverside | 8,074 | 3,891 | 1,145 | 29% | between May and July | Link |
| UCSD | 29,087 | 19,373 | 2,616 | 14% | mid-late summer | Link |
| UCSB | 15,689 | 9,670 | 5,493 | 57% | early May - July | Link |
| UCSC | 18,398 | 12,285 | 10,812 | 88% | between May and July | Link |
| UChicago | early summer | Link | ||||
| Georgia | 3,842 | 1,904 | 739 | 39% | by mid July, split into 2 groups (OOS/Intl and In-State); 3,627 waitlisted | Link |
| UIUC | 3,073 | 1,881 | 56 | 3% | by 6/30 | Link |
| UMass Amherst | 11,588 | 6,628 | 1,701 | 26% | beginning after 5/1 | Link |
| University of Miami | 21,869 | 7,758 | 215 | 3% | by 6/15 | Link |
| Michigan | 26,898 | 18,321 | 955 | 5% | typically by 6/30 | Link |
| UNC - Chapel Hill | by 6/30 | Link | ||||
| Notre Dame | 2,784 | 1,811 | 90 | 5% | begins between 5/3-5/15 | Link |
| Oregon | 1,111 | 435 | 235 | 54% | by 7/31 | Link |
| Pitt | 8,248 | 3,811 | 768 | 20% | on or before 6/1 | Link |
| URichmond | 4,098 | 2,178 | 36 | 2% | by 6/30 | Link |
| U Rochester | 2,108 | 1,191 | 185 | 16% | by 8/1 | Link |
| USD | 3,617 | 2,095 | 102 | 5% | after 5/1 | Link |
| Tennessee | 8,717 | 3,226 | 571 | 18% | Link | |
| Virginia | 57 offers on 4/9 and a small number on 5/16; concluded 6/12 | Link | ||||
| Washington | 7,915 | 4,122 | 2,985 | 72% | after 6/1 | Link |
| Wisconsin | 13,364 | 7,221 | 4,436 | 61% | by 7/31 | Link |
| Vanderbilt | early May - end of June | Link | ||||
| Vassar | 919 | 501 | 60 | 12% | ||
| Virginia Tech | 12,348 | 7,148 | 0 | 0% | by 7/1 | Link |
| Washington and Lee | 1,268 | 669 | 0 | 0% | after 5/1 | Link |
| WUSTL | by 6/30 | Link | ||||
| Wellesley | 2,389 | 1,180 | 19 | 2% | before 8/1 | Link |
| Wesleyan | 2,532 | 1,359 | 201 | 15% | by 6/30 | Link |
| Williams | 1,606 | 637 | 3 | 0% | begins in May, typically 600-750 students on WL | Link |
| Yale | 1,145 | 899 | 0 | 0% | 773 offered WL | Link |
- Tags: American, Amherst, Bates, Boston College, Brandeis, Brown, Bryn Mawr, Bucknell, Cal Poly San Luis Obispo, Carleton, Carnegie Mellon, Claremont McKenna, Class of 2028, Clemson, Colby, Colgate, College of Wooster, Colorado College, Colorado School of Mines, Columbia, Connecticut College, Cornell, Dartmouth, Davidson, Dickinson, Elon, Georgetown, Georgia Tech, Grinnell, Hamilton, Harvey Mudd, Haverford, Holy Cross, Johns Hopkins, Kenyon, Lafayette, Lehigh, Lewis and Clark, Macalester, Miami University - Oxford, Michigan, Middlebury, MIT, Pitzer, Pomona, Princeton, Providence, Purdue, Rhodes, Rice, RPI, Santa Clara, Scripps, Sewanee, Skidmore, Smith, SMU, Stanford, Swarthmore, Syracuse, Trinity College, Tufts, UC Davis, UC Irvine, UC Riverside, UC Santa Barbara, UMass Amherst, UNC Chapel Hill, Union, Union College, University of Chicago, University of Georgia, University of Pennsylvania, University of Richmond, University of Rochester, University of San Diego, University of Virginia, University of Washington, USC, UT Austin, Vanderbilt, Vassar, Villanova, Virginia Tech, Waitlist, Washington and Lee, Wellesley, Wesleyan, William & Mary, Williams, WPI, Yale
Get our latest data and insights
Give your college plan a boost
Balance list, maximize odds and minimize wasted motion. Current data and personalized recommendations.
Students, learn more Counselors, learn more
Archives
- Your College List (110)
- Early Admission (251)
- Standardized Testing (16)
- Class of 2029 (53)
- Class of 2028 (54)
- Class of 2027 (64)
- Class of 2026 (62)
- Class of 2025 (78)
- Class of 2024 (69)
- Class of 2023 (87)
- Class of 2022 (82)
- Class of 2021 (80)
- Class of 2020 (65)
- Class of 2019 (6)
- Waitlist (11)
- Financial Aid (4)
- College Tour Planner (0)
- Whirlwind Tours (0)
- Essays (9)
- College Kickstart (58)
- Product Announcements (12)
- Perspectives (102)
- College Rankings (28)
- Affordability (12)
- AP Exams (3)
- Miscellaneous (11)
Hot Topics
- University of Pennsylvania
- Northwestern
- Class of 2023
- Columbia
- Class of 2022
- Early Action
- Middlebury
- Wesleyan
- University of Virginia
- Cornell
- UC Berkeley
- Vanderbilt
- Ivy League
- Stanford
- MIT
- UC Santa Barbara
- UC Davis
- Claremont McKenna
- Yale
- Boston College
- Pomona
- Emory
- Colby
- Bowdoin
- Class of 2021
- Dartmouth
- Brown
- Notre Dame
- Johns Hopkins
- Boston University
- Duke
- Rice
- Williams
- Georgia Tech
- Harvard
- Early Decision
- Georgetown
- Princeton
- UC Irvine
- UCLA