Articles tagged with: James Madison
 As we entered 2020, roughly one-third of the schools in our coverage universe offered some form of test-optional admissions. That
figure cleared 70 percent in June and is now hovering at 90 percent with the holdouts largely in the South, particularly the public universities in Flordia and Georgia.
As we entered 2020, roughly one-third of the schools in our coverage universe offered some form of test-optional admissions. That
figure cleared 70 percent in June and is now hovering at 90 percent with the holdouts largely in the South, particularly the public universities in Flordia and Georgia.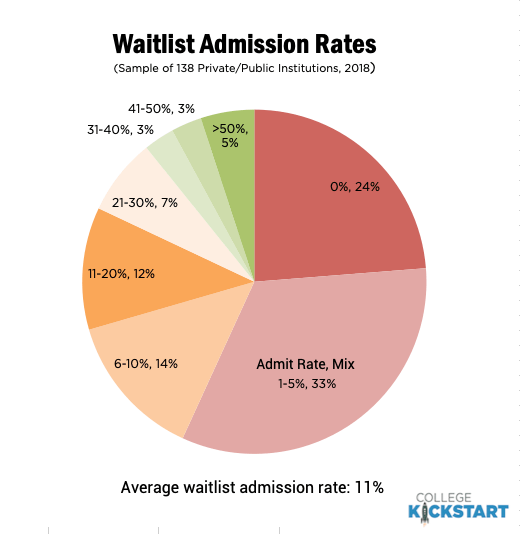 For those of you that have been waitlisted at one of your top choices, here's a list of 2018 waitlist statistics for several popular private and public schools, along with notification dates and latest status where available.
 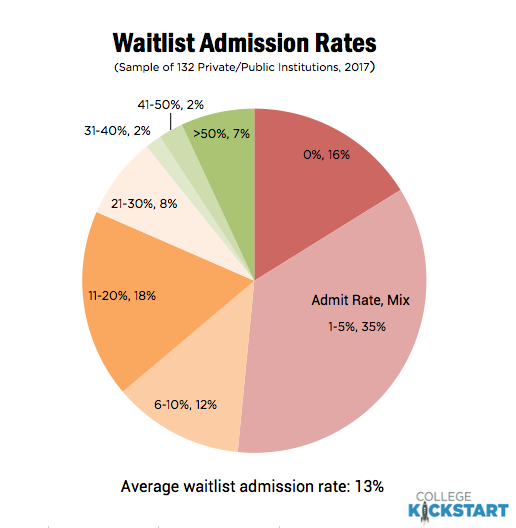 For those of you that have been waitlisted at one of your top choices, here's a list of 2017 waitlist statistics for several popular private and public schools, along with notification dates and latest status where available.
 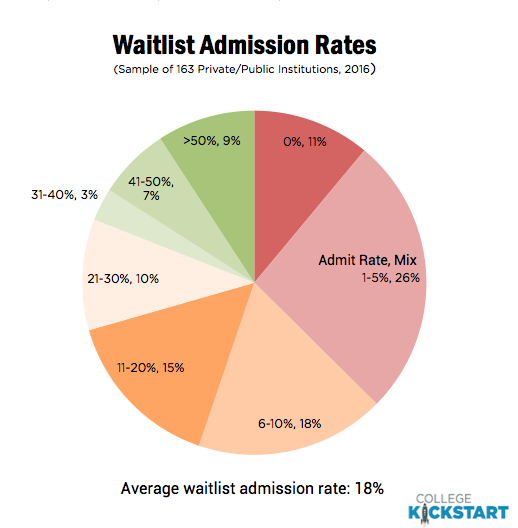 For those of you that have been waitlisted at one of your top choices, here's a list of 2016 waitlist statistics for several popular private and public schools, along with notification dates and latest status where available.
  A group of 80 higher education institutions called the Coalition for Access, Affordability and Success will be introducing a new alternative to the Common Application in 2016. Designed to level the playing field for college admissions, the Coalition will deliver free tools to increase transparency around admissions and financial aid and promote awareness and engagement prior to senior year.
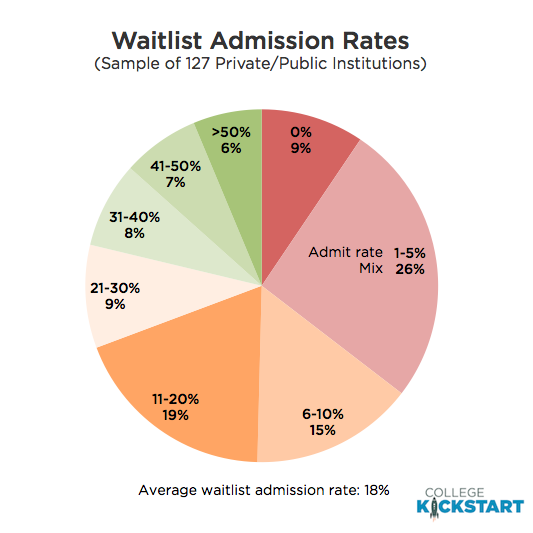 For those of you that have been waitlisted at one of your top choices, here's a list of waitlist statistics for several popular private and public schools, along with notification dates and links for more detail if available.
 Get our latest data and insights
Give your college plan a boost
Balance list, maximize odds and minimize wasted motion. Current data and personalized recommendations.
Students, learn more Counselors, learn more
Archives
- Your College List (110)
- Early Admission (251)
- Standardized Testing (16)
- Class of 2029 (53)
- Class of 2028 (54)
- Class of 2027 (64)
- Class of 2026 (62)
- Class of 2025 (78)
- Class of 2024 (69)
- Class of 2023 (87)
- Class of 2022 (82)
- Class of 2021 (80)
- Class of 2020 (65)
- Class of 2019 (6)
- Waitlist (11)
- Financial Aid (4)
- College Tour Planner (0)
- Whirlwind Tours (0)
- Essays (9)
- College Kickstart (58)
- Product Announcements (12)
- Perspectives (102)
- College Rankings (28)
- Affordability (12)
- AP Exams (3)
- Miscellaneous (11)
Hot Topics
- Colby
- Early Decision
- Ivy League
- Wesleyan
- Stanford
- Rice
- Notre Dame
- UC Berkeley
- Georgia Tech
- Pomona
- Bowdoin
- Claremont McKenna
- Princeton
- UCLA
- Vanderbilt
- Northwestern
- Columbia
- Brown
- Boston University
- Cornell
- UC Santa Barbara
- Boston College
- Class of 2023
- Duke
- UC Irvine
- Class of 2022
- Class of 2021
- University of Pennsylvania
- UC Davis
- Georgetown
- MIT
- Emory
- Dartmouth
- Johns Hopkins
- Yale
- University of Virginia
- Early Action
- Harvard
- Williams
- Middlebury